
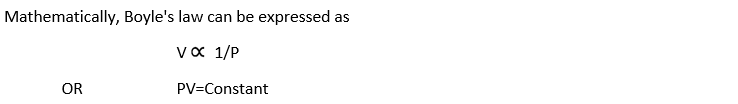
Boyle’s Law
Introduction:
In 1662, Boyle found a relationship between volume and pressure of gases. He announced this relationship in the form of a law known as Boyle’s law.
Statement:
“At constant temperature, volume of a given mass of a gas is inversely proportional to pressure exerted on it.”
OR
“Product of pressure and volume of a given mass of a gas is constant provided the temperature remains constant.
Mathematical Form:
If pressure of a given mass of a gas is P1 and volume is V1, then changing pressure to P2, the volume will change to V2, such that
P1V1 = P2V2 = Constant (at constant temperature)
Experimental Verification of Boyle’s Law
It is clear from the diagram, that vessel contains 1 dm3 of a gas at 2 atm pressure and 25°C temperature. When the pressure is increased from 2 atm to 4 atm at the same temperature, volume of the gas becomes ½ dm3. Similarly, when the pressure is increased from 4 atm to 6 atm at the same temperature, volume of the gas becomes 1/3 dm3. It means that volume of the given mass of the gas is decreasing with the increase in pressure at the same temperature.
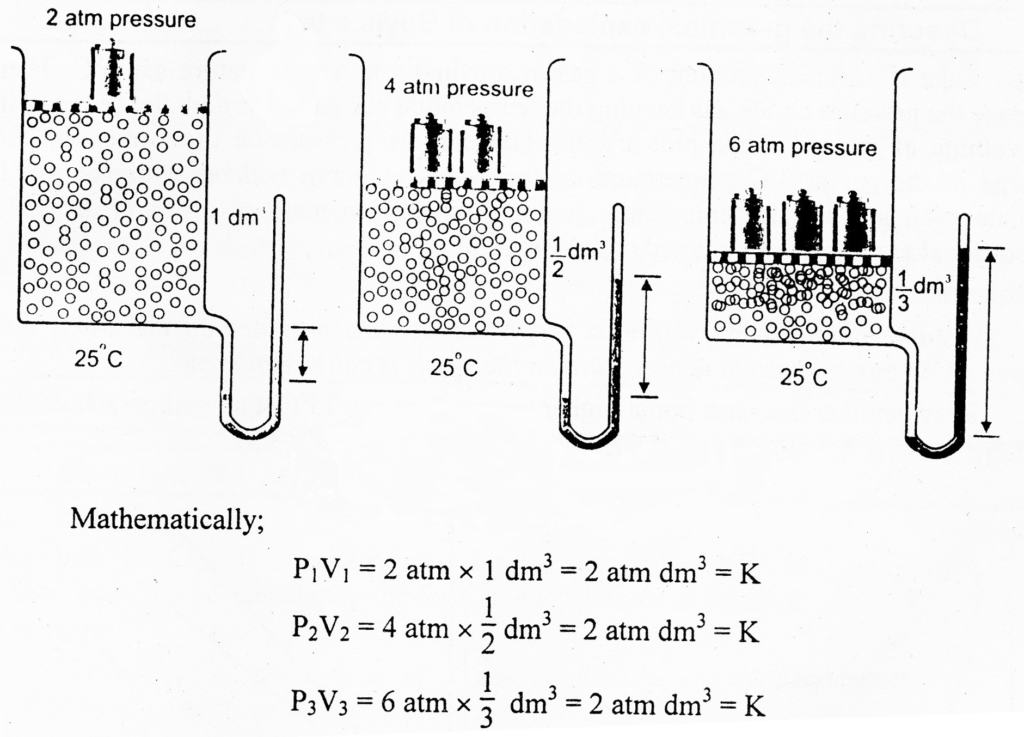
The above calculations verify Boyle’s law.
Graphical Explanation of Boyle’s Law
Take a particular amount of a gas in a cylinder at a temperature say 0°C. Then increase the pressure on the gas keeping the temperature constant and note the decrease in the volume of the gas. Then plot a graph between the pressure on the x-axis and the volume of the gas at 0°C temperature on the y-axis. A curve will be obtained, which indicates that at constant temperature, volume of a given mass of a gas is inversely proportional to the pressure exerted on it.
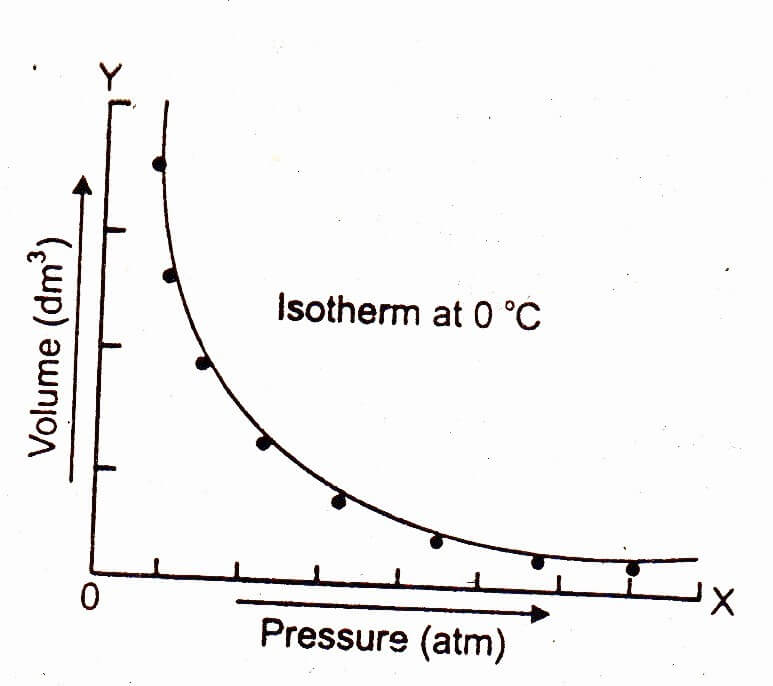
Isotherm:
A curve obtained by plotting a graph between the pressure on the x-axis and volume of the gas at constant temperature on the y-axis is called isotherm. Draw another isotherm but at higher temperature say 25°C, this will go away from both the axes i.e. it will be above the isotherm drawn at 0°C.
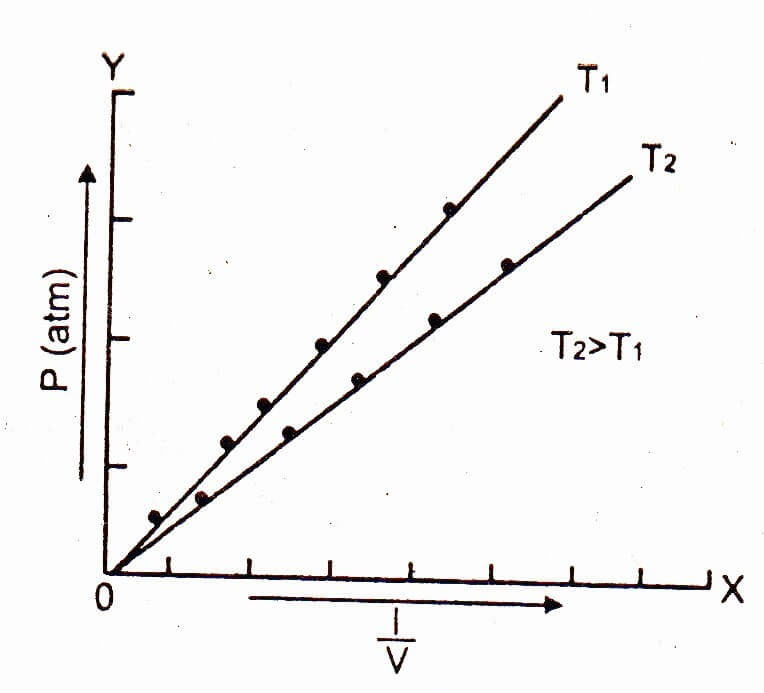
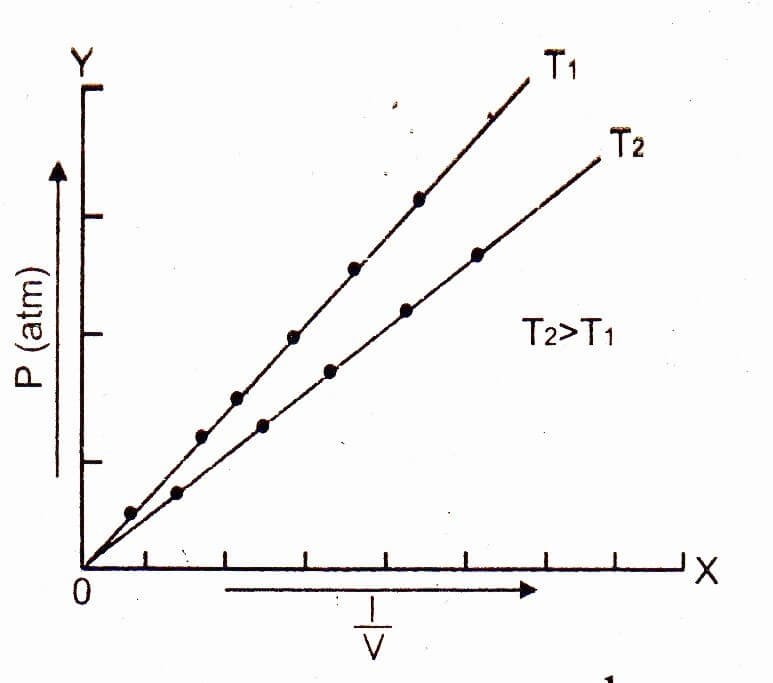
Plot a graph between – on the x-axis and the pressure P on the y-axis, then a straight line is obtained. This shows that inverse of the volume and pressure is directly proportional to each other. The straight line meets at the origin which means that the pressure is very close to zero, the volume is so high that its inverse is very close to zero.
At higher temperature, draw another graph between + on the x-axis and the pressure on the y-axis, then another straight line will be obtained but closer to x-axis.
Plot a graph between the pressure on the x-axis and the product PV on y-axis. Then a straight line parallel to the pressure axis is obtained.

The straight line shows that K is a constant quantity. At higher temperature, volume of the gas increases, but PV remains the constant and a straight line parallel to the pressure axis is obtained. This type of straight line will help us to understand the non-ideal behavior of gases. Boyle’s law is applicable only to ideal gases.